MIRAE ASSET
NIFTY 100 ESG SECTOR LEADERS ETF - (NSE Symbol : ESG, BSE Code: 543246)
(An open ended scheme replicating/tracking Nifty 100 ESG Sector Leaders Total Return Index)
| Type of Scheme | An open ended scheme replicating/tracking Nifty 100 ESG Sector Leaders Total Return Index |
| Investment Objective | The investment objective of the scheme is to generate returns, before expenses, that are commensurate with the performance of the Nifty 100 ESG Sector Leaders Total Return Index, subject to tracking error. The Scheme does not guarantee or assure any returns. |
Fund Manager** |
Ms. Ekta Gala (since November 17, 2020) Mr. Akshay Udeshi (since August 28, 2023) |
| Allotment Date | 17th November, 2020 |
| Benchmark Index | NIFTY 100 ESG Sector Leaders Index (TRI) |
| Minimum Investment Amount^ |
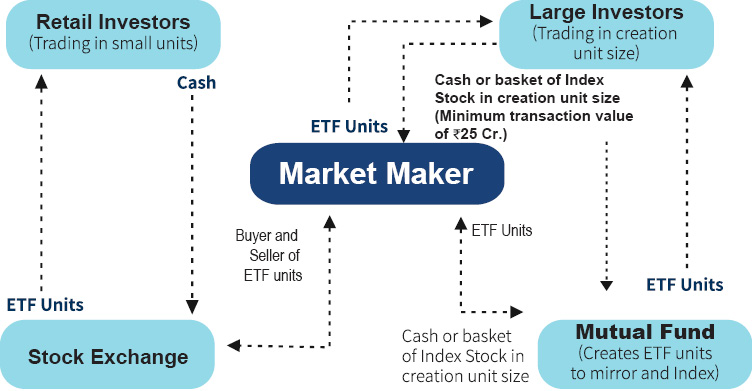
Market Maker: Application for subscription of Units directly with the Fund in Creation Unit Size at NAV based prices in exchange of Portfolio Deposit and Cash Component. Large Investors: Minimum amount of ₹25 crores for transacting directly with the AMC. Other investors (including Market Maker, Large Investors and Regulated Entities): Units of the Scheme can be subscribed (in lots of 1 Unit) during the trading hours on all trading days on the NSE and BSE on which the Units are listed. On exchange (in multiple of 1 units), Directly with AMC or Market Maker (in multiple of 2,50,000 units) |
Systematic Investment Plan (SIP) (Any Date SIP is available from 1st July, 2019) |
NA |
| Load Structure | Entry load: NA Exit load: For Creation Unit Size: No Exit load will be levied on redemptions made by Market Makers / Large Investors directly with the Fund in Creation Unit Size. For other than Creation Unit Size: Not Applicable -The Units of Mirae Asset Nifty 100 ESG Sector Leaders ETF in other than Creation Unit Size cannot ordinarily be directly redeemed with the Fund. These Units can be redeemed (sold) on a continuous basis on the Exchange(s) where it is listed during the trading hours on all trading days. |
| Plans Available Options Available |
The Scheme does not offer any Plans/Options for investment |
| Monthly Average AUM (₹ Cr.) as on February 29, 2024 | 135.46 |
| Net AUM (₹ Cr.) | 133.71 |
| Tracking Error Value~ ~1 Year Tracking Error is |
0.11% |
| Monthly Total Expense Ratio (Including Statutory Levies) as on February 29, 2024 | 0.58% |
| **For experience of Fund Managers Click Here | |
| ^The applicability of said threshold limit for all investors (other than Market Makers) has been extended for the below categories of investors till April 30, 2024:- 1. Schemes managed by Employee Provident Fund Organisation, India. 2. Recognized Provident Funds, Approved Gratuity Funds and Approved Superannuation Funds under Income Tax Act, 1961. |
|
| ₹ 36.7464 (Per Unit) |
Mirae Asset Capital Markets (India) Private Limited
East India Securities Limited
Kanjalochana Finserve Private Limited
Parwati Capital Market Private Limited
| Portfolio Holdings | % Allocation | |
Equity Shares |
ESG score^ | |
| Reliance Industries Limited | 10.51% |
69.00 |
| HDFC Bank Limited | 7.98% |
79.80 |
| ICICI Bank Limited | 7.85% |
76.60 |
| Infosys Limited | 6.35% |
82.40 |
| Tata Consultancy Services Limited | 4.41% |
73.80 |
| Larsen & Toubro Limited | 4.37% |
71.00 |
| Axis Bank Limited | 3.17% |
81.60 |
| Bharti Airtel Limited | 3.02% |
74.90 |
| Kotak Mahindra Bank Limited | 2.64% |
82.30 |
| Hindustan Unilever Limited | 2.29% |
72.20 |
| Bajaj Finance Limited | 1.92% |
76.10 |
| HCL Technologies Limited | 1.87% |
79.60 |
| Mahindra & Mahindra Limited | 1.84% |
72.40 |
| Sun Pharmaceutical Industries Limited | 1.81% |
64.30 |
| Tata Motors Limited | 1.78% |
76.90 |
| NTPC Limited | 1.70% |
66.10 |
| Titan Company Limited | 1.61% |
74.00 |
| Maruti Suzuki India Limited | 1.59% |
68.50 |
| Power Grid Corporation of India Limited | 1.37% |
61.30 |
| Asian Paints Limited | 1.35% |
76.10 |
| Tata Steel Limited | 1.22% |
69.60 |
| UltraTech Cement Limited | 1.21% |
72.80 |
| IndusInd Bank Limited | 1.04% |
80.40 |
| Adani Ports and Special Economic Zone Limited | 1.03% |
74.10 |
| Nestle India Limited | 0.98% |
74.20 |
| Zomato Limited | 0.94% |
69.60 |
| Bajaj Finserv Limited | 0.92% |
77.20 |
| Adani Enterprises Limited | 0.92% |
65.60 |
| Trent Limited | 0.91% |
69.80 |
| Grasim Industries Limited | 0.86% |
67.40 |
| Tech Mahindra Limited | 0.85% |
81.00 |
| Dr. Reddy's Laboratories Limited | 0.83% |
74.60 |
| Cipla Limited | 0.83% |
71.10 |
| JSW Steel Limited | 0.81% |
69.60 |
| Wipro Limited | 0.78% |
81.00 |
| Tata Consumer Products Limited | 0.76% |
66.30 |
| Adani Green Energy Limited | 0.73% |
66.20 |
| Tata Power Company Limited | 0.67% |
72.00 |
| HDFC Life Insurance Company Limited | 0.65% |
74.80 |
| Indian Oil Corporation Limited | 0.65% |
69.60 |
| Avenue Supermarts Limited | 0.62% |
64.90 |
| DLF Limited | 0.62% |
68.30 |
| Hero MotoCorp Limited | 0.61% |
77.00 |
| Eicher Motors Limited | 0.55% |
73.20 |
| TVS Motor Company Limited | 0.53% |
72.60 |
| GAIL (India) Limited | 0.52% |
73.30 |
| LTIMindtree Limited | 0.52% |
78.40 |
| Godrej Consumer Products Limited | 0.51% |
74.80 |
| InterGlobe Aviation Limited | 0.48% |
72.20 |
| Divi's Laboratories Limited | 0.47% |
73.20 |
| Cholamandalam Investment and Finance Company Ltd | 0.47% |
79.10 |
| ICICI Lombard General Insurance Company Limited | 0.47% |
75.40 |
| Pidilite Industries Limited | 0.44% |
66.20 |
| Siemens Limited | 0.44% |
66.50 |
| Info Edge (India) Limited | 0.43% |
70.60 |
| Shree Cement Limited | 0.36% |
66.20 |
| Colgate Palmolive (India) Limited | 0.36% |
73.50 |
| Adani Energy Solutions Limited | 0.34% |
69.20 |
| Dabur India Limited | 0.33% |
77.10 |
| PI Industries Limited | 0.31% |
69.90 |
| ABB India Limited | 0.31% |
68.30 |
| Jindal Steel & Power Limited | 0.30% |
69.80 |
| Adani Total Gas Limited | 0.30% |
74.40 |
| Indian Railway Catering And Tourism Corporation Limited | 0.30% |
67.60 |
| Marico Limited | 0.29% |
74.80 |
| Torrent Pharmaceuticals Limited | 0.26% |
70.00 |
| Bosch Limited | 0.26% |
70.00 |
| Zydus Lifesciences Limited | 0.25% |
70.30 |
| UPL Limited | 0.25% |
69.60 |
| SBI Cards and Payment Services Limited | 0.23% |
78.30 |
| ICICI Prudential Life Insurance Company Limited | 0.22% |
77.30 |
| Muthoot Finance Limited | 0.15% |
74.80 |
| Equity Holding Total | 99.55% |
73.75 Weighted Average Fund Score |
Cash & Other Receivables Total |
0.45% |
|
Total |
100.00% |
^Note: This section contains information developed by Stakeholders Empowerment Services. Such information and data are proprietary of Stakeholders Empowerment Services and/or its third party suppliers (Third Party Data) and are provided for informational purposes only. They do not constitute an endorsement of any product or project, nor an investment advice and are not warranted to be complete, timely, accurate or suitable for a particular purpose. Their use is subject to conditions available at https://www.sesgovernance.com/
| Returns (in%) | |||||||
| 1 Year | 3 Years | Since inception | Value of 10000 invested Since Inception (in Rs.) | ||||
| Mirae Asset Nifty 100 ESG Sector Leaders ETF | 30.53% |
14.46% |
16.37% |
16,455 |
|||
| Scheme Benchmark* | 31.69% |
15.26% |
17.25% |
16,869 |
|||
| Additional Benchmark** | 24.58% |
15.26% |
17.81% |
17,134 |
|||
| NAV as on 29th February, 2024 | ₹ 36.7464 | ||||||
| Index Value (29th February, 2024) | Index Value of benchmark is 4,154.19 and S&P BSE Sensex (TRI) is 1,11,227.59 |
||||||
| Allotment Date | 17th November, 2020 | ||||||
| Scheme Benchmark | *Nifty 100 ESG Sector Leaders Index (TRI) | ||||||
| Additional Benchmark | **S&P BSE Sensex (TRI) | ||||||
Fund manager : Ms. Ekta Gala & Mr. Akshay Udeshi managing the scheme since November 17, 2020 & (w.e.f August 28, 2023) respectively.
Note: Returns below or for 1 year are absolute returns, returns above 1 year are CAGR- Compounded Annualized Growth returns.
Latest available NAV has been taken for return calculation wherever applicable
Past Performance may or may not be sustained in future.
Note : For computation of since inception returns (%) the allotment NAV has been taken as ₹22.344. The performance of other funds managed by the same fund manager is given in the respective page of the schemes 
Different Plans under the scheme has different expense structure. The reference and details provided here in are of Regular Plan - Growth Option
Live iNav is updated on Mirae Asset Mutual Fund website
NSE Symbol : ESG
BSE Code: 543246
Bloomberg Code: ESG IN Equity
Reuters Code: MIRA.NS
This product is suitable for investors who are seeking*
• Returns that are commensurate with the performance of NIFTY 100 ESG Leaders Total Return Index, subject to tracking error over long term
• Investments in equity securities covered by NIFTY 100 ESG Leaders Total Return Index
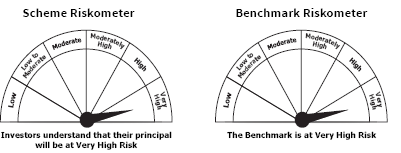
*Investors should consult their financial advisers if they are not clear about the suitability of the product.