MIRAE ASSET
MIDCAP FUND - (MAMCF)
(Midacap Fund - An open ended equity scheme predominantly investing in mid cap stocks)
| Type of Scheme | An open ended equity scheme predominantly investing in mid cap stocks |
| Investment Objective | The investment objective of the scheme is to provide long-term capital appreciation from a portfolio investing predominantly in Indian equity and equity related securities of midcap companies. From time to time, the fund manager may also participate in other Indian equities and equity related securities for optimal portfolio construction. There is no assurance that the investment objective of the Scheme will be realized. |
Fund Manager** |
Mr. Ankit Jain (since inception) |
| Allotment Date | 29th July, 2019 |
| Benchmark Index | Nifty Midcap 150 (TRI) |
| Minimum Investment Amount |
₹ 5,000/- and in multiples of ₹ 1/-thereafter. Minimum Additional Application Amount: ₹ 1,000/- per application and in multiples of ₹ 1/- thereafter. |
Systematic Investment Plan (SIP) (Any Date SIP is available from 1st July, 2019) |
Monthly and Quarterly: ₹1,000/- (multiples of ₹1/- thereafter), minimum 5 in case of Monthly or 3 in case of Quarterly option. |
| Load Structure | Entry load: NA Exit load: If redeemed within 1 year (365 days) from the date of allotment: 1%. If redeemed after 1 year (365 days) from the date of allotment: NIL |
| Plans Available | Regular Plan and Direct Plan |
| Options Available | Growth Option and IDCW Option (Payout & Re-investment) |
| Monthly Average AUM (₹ Cr.) as on August 31, 2023 | 11,527.53 |
| Net AUM (₹ Cr.) |
11,919.25 |
| Monthly Total Expense Ratio (Including Statutory Levies) as on August 31, 2023 |
Regular Plan: 1.73% Direct Plan: 0.65% |
| **For experience of Fund Managers Click Here | |
| NAV: | Direct | Regular |
| Growth | ₹ 27.532 | ₹ 25.981 |
| IDCW | ₹ 23.188 | ₹ 21.744 |
| New Position Bought |
| Stock |
| Cement & Cement Products |
| ACC Limited |
| Chemicals & Petrochemicals |
| Navin Fluorine International Limited |
| Commercial Services & Supplies |
| TeamLease Services Limited |
| Positions Increased |
| Stock |
| Auto Components |
| CEAT Limited |
| Motherson Sumi Wiring India Limited |
| Banks |
| State Bank of India |
| Utkarsh Small Finance Bank Ltd |
| Capital Markets |
| HDFC Asset Management Company Limited |
| Consumer Durables |
| Bata India Limited |
| Fertilizers & Agrochemicals |
| Bayer Cropscience Limited |
| Finance |
| LIC Housing Finance Limited |
| Gas |
| Gujarat State Petronet Limited |
| Indraprastha Gas Limited |
| Healthcare Services |
| Fortis Healthcare Limited |
| Insurance |
| Star Health And Allied Insurance Company Limited |
| IT - Software |
| Coforge Limited |
| Minerals & Mining |
| NMDC Limited |
| Pharmaceuticals & Biotechnology |
| IPCA Laboratories Limited |
| Retailing |
| FSN E-Commerce Ventures Limited |
| Textiles & Apparels |
| Page Industries Limited |
| Transport Services |
| Container Corporation of India Limited |
| Positions Decreased |
| Stock |
| Aerospace & Defense |
| Bharat Electronics Limited |
| Auto Components |
| Craftsman Automation Limited |
| Capital Markets |
| UTI Asset Management Company Limited |
| Cement & Cement Products |
| Nuvoco Vistas Corporation Limited |
| Consumer Durables |
| Dixon Technologies (India) Limited |
| Kajaria Ceramics Limited |
| Electrical Equipment |
| Thermax Limited |
| Ferrous Metals |
| Jindal Steel & Power Limited |
| Finance |
| Shriram Finance Limited |
| Healthcare Services |
| Krishna Institute Of Medical Sciences Limited |
| Industrial Products |
| Bharat Forge Limited |
| Insurance |
| Max Financial Services Limited |
| IT - Software |
| MphasiS Limited |
| Leisure Services |
| The Indian Hotels Company Limited |
| Westlife Foodworld Limited |
| Pharmaceuticals & Biotechnology |
| Ajanta Pharma Limited |
| Telecom - Services |
| Tata Communications Limited |
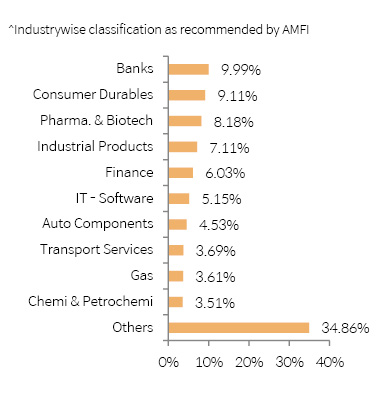
| Portfolio Holdings | % Allocation |
| Banks | |
| The Federal Bank Ltd | 3.58% |
| Axis Bank Ltd | 2.21% |
| State Bank of India | 2.10% |
| Indian Bank | 1.52% |
| Utkarsh Small Finance Bank Ltd | 0.58% |
| Consumer Durables | |
| Bata India Ltd | 2.31% |
| Crompton Greaves Consumer Electricals Ltd | 2.18% |
| Kajaria Ceramics Ltd | 1.79% |
| Century Plyboards (India) Ltd | 1.09% |
| Dixon Technologies (India) Ltd | 0.87% |
| Voltas Ltd | 0.86% |
| Pharmaceuticals & Biotechnology | |
| Lupin Ltd | 2.70% |
| Natco Pharma Ltd | 1.48% |
| Laurus Labs Ltd | 1.17% |
| IPCA Laboratories Ltd | 1.16% |
| Biocon Ltd | 1.11% |
| Ajanta Pharma Ltd | 0.56% |
| Industrial Products | |
| Bharat Forge Ltd | 3.43% |
| SKF India Ltd | 2.38% |
| Prince Pipes And Fittings Ltd | 1.31% |
| Finance | |
| Power Finance Corporation Ltd | 2.38% |
| Shriram Finance Ltd | 2.31% |
| LIC Housing Finance Ltd | 1.35% |
| IT - Software | |
| Coforge Ltd | 2.42% |
| LTIMindtree Ltd | 2.05% |
| MphasiS Ltd | 0.67% |
| Auto Components | |
| CEAT Ltd | 1.65% |
| Motherson Sumi Wiring India Ltd | 1.10% |
| Sona BLW Precision Forgings Ltd | 0.91% |
| Craftsman Automation Ltd | 0.86% |
| Transport Services | |
| Delhivery Ltd | 2.24% |
| Container Corporation of India Ltd | 1.45% |
| Gas | |
| Gujarat State Petronet Ltd | 1.91% |
| Indraprastha Gas Ltd | 1.70% |
| Chemicals & Petrochemicals | |
| Atul Ltd | 1.45% |
| Chemplast Sanmar Ltd | 0.80% |
| Sudarshan Chemical Industries Ltd | 0.74% |
| Navin Fluorine International Ltd | 0.53% |
| Insurance | |
| Max Financial Services Ltd | 2.21% |
| Star Health And Allied Insurance Company Ltd | 0.88% |
| Cement & Cement Products | |
| JK Cement Ltd | 1.69% |
| Nuvoco Vistas Corporation Ltd | 0.85% |
| ACC Ltd | 0.53% |
| Healthcare Services | |
| Fortis Healthcare Ltd | 1.86% |
| Krishna Institute Of Medical Sciences Ltd | 0.80% |
| Telecom - Services | |
| Tata Communications Ltd | 2.41% |
| Power | |
| NTPC Ltd | 2.31% |
| Electrical Equipment | |
| Thermax Ltd | 2.07% |
| Fertilizers & Agrochemicals | |
| Bayer Cropscience Ltd | 1.97% |
| Capital Markets | |
| HDFC Asset Management Company Ltd | 1.32% |
| UTI Asset Management Company Ltd | 0.61% |
| Industrial Manufacturing | |
| Honeywell Automation India Ltd | 1.48% |
| Tega Industries Ltd | 0.28% |
| Leisure Services | |
| Westlife Foodworld Ltd | 0.86% |
| The Indian Hotels Company Ltd | 0.80% |
| Personal Products | |
| Emami Ltd | 1.59% |
| Automobiles | |
| TVS Motor Company Ltd | 1.51% |
| Financial Technology (Fintech) | |
| PB Fintech Ltd | 1.51% |
| Realty | |
| Prestige Estates Projects Ltd | 1.37% |
| Ferrous Metals | |
| Jindal Steel & Power Ltd | 1.27% |
| Retailing | |
| FSN E-Commerce Ventures Ltd | 1.26% |
| Textiles & Apparels | |
| Page Industries Ltd | 1.19% |
| Minerals & Mining | |
| NMDC Ltd | 0.97% |
| Aerospace & Defense | |
| Bharat Electronics Ltd | 0.78% |
| Paper, Forest & Jute Products | |
| JK Paper Ltd | 0.25% |
| Commercial Services & Supplies | |
| TeamLease Services Ltd | 0.24% |
| Equity Holding Total | 95.77% |
| Cash & Other Receivables | 4.23% |
| Total | 100.00% |
| Returns (in%) | ||||
| 1 Yr | 3 Yrs | SI | ||
| MAMCF | 19.43% | 32.08% | 26.27% | |
| Scheme Benchmark* | 24.63% | 33.31% | 26.57% | |
| Additional Benchmark** | 10.31% | 20.30% | 15.55% | |
| NAV as on 31st August, 2023 | ₹ 25.981 | |||
| Index Value (31st August, 2023) | Index Value of Scheme benchmark is 18,453.64 and S&P BSE Sensex (TRI) is 99,117.59 |
|||
| Allotment Date | 29 July, 2019 | |||
| Scheme Benchmark | *Nifty Midcap 150 (TRI) | |||
| Additional Benchmark | **S&P BSE Sensex (TRI) | |||
Fund manager : Mr. Ankit Jain managing the scheme since July, 2019
Note: Returns below or for 1 year are absolute returns, returns above 1 year are CAGR- Compounded Annualized Growth returns.
Past Performance may or may not be sustained in future.
Past Performance may or may not be sustained in future.
Note : For computation of since inception returns (%) the allotment NAV has been taken as ₹ 10.00. The performance of other funds managed by the same fund manager is given in the respective page of the schemes 
Different Plans under the scheme has different expense structure. The reference and details provided here in are of Regular Plan - Growth Option
| Period | Total Amount Invested | Mkt Value as on 31-August-2023 |
SI |
4,90,000 | 8,43,186 |
3 Yrs |
3,60,000 | 5,08,049 |
1 Yr |
1,20,000 | 1,42,783 |
Returns (%) |
Period |
||
SI |
3yrs |
1yr |
|
Fund Return& (%) |
27.32 | 23.72 | 37.07 |
Benchmark Return& (%) |
29.22 | 26.52 | 42.29 |
Add. Benchmark Return& (%) |
16.37 | 13.50 | 13.40 |
& The SIP returns are calculated by XIRR approach assuming investment of ₹ 10,000/- on the 1st working day of every month.
| Regular Plan | |||
| Record Date | Quantum (₹ per unit) |
Face Value (₹ per unit) |
NAV (₹ per unit) |
14-Feb-23 |
1.75 |
10.00 |
19.170 |
| Direct Plan | |||
| Record Date | Quantum (₹ per unit) |
Face Value (₹ per unit) |
NAV (₹ per unit) |
14-Feb-23 |
1.70 |
10.00 |
20.220 |
Past Performance may or may not be sustained in future. Pursuant to payment of IDCW the NAV of the IDCW option of the scheme will fall to the extent of payout and statutory levy (if any). IDCW history is for MAMCF - Regular & Direct Plan - IDCW Option
| Volatility | 15.17% |
| Beta: | 0.84 |
| R Squared | 0.86 |
| Sharpe Ratio#: | 1.67 |
| Information Ratio | -0.20 |
| Portfolio Turnover Ratio | 0.39 times |
@The Volatility, Beta, R Squared, Sharpe Ratio & Information Ratio are calculated on returns from last three years Monthly data points. # Risk free rate: FBIL OVERNIGHT MIBOR as on 31st August, 2023. ^Basis last rolling 12 months. |
|
This product is suitable for investors who are seeking*
• To generate long term capital appreciation/income.
• Investments predominantly in equity & equity related securities of midcap companies
*Investors should consult their financial advisers if they are not clear about the suitability of the product.