MIRAE ASSET
LARGE CAP FUND - (MALCF)
(Large Cap Fund - An open ended equity scheme predominantly investing across large cap stocks) | Type of Scheme | Large Cap Fund - An open ended equity scheme predominantly investing across large cap stocks |
| Investment Objective | The investment objective of the scheme is to generate long term capital appreciation by capitalizing on potential investment opportunities by predominantly investing in equities of large cap companies. The Scheme does not guarantee or assure any returns. |
Fund Managers** |
Mr. Gaurav Misra
(since January 31, 2019), and Mr. Gaurav Khandelwal (since October 18, 2021) |
| Allotment Date | 04th April, 2008 |
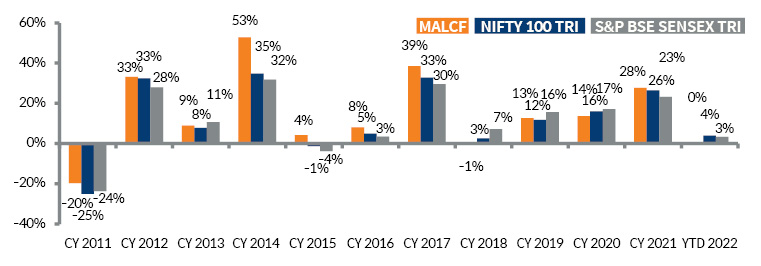
| Benchmark Index | NIFTY 100 Index (TRI) |
| Minimum Investment Amount |
₹ 5,000/- and in multiples of ₹ 1/-thereafter. Minimum Additional Application Amount: ₹1,000/- per application and in multiples of ₹ 1/- thereafter. |
Systematic Investment Plan (SIP) (Any Date SIP is available from 1st July, 2019) |
Monthly and Quarterly: Minimum of ₹ 1000/- (multiples of ₹ 1/- thereafter), minimum 5 in case of Monthly or 3 in case of Quarterly option. |
| Load Structure | Entry load: NA Exit load: I. For investors who have opted for SWP under the plan: a) 15% of the units allotted (including Switch-in/STP - in) on or before completion of 365 days from the date of allotment of units: Nil. b) Any redemption in excess of such limits in the first 365 days from the date of allotment shall be subject to the following exit load: (Redemption of units would be done on First In First Out Basis (FIFO): •If redeemed within 1 year (365 days) from the date of allotment: 1% •If redeemed after 1 year (365 days) from the date of allotment: NIL II. Other Redemptions: For Investors who have not opted for SWP under the plan (including Switch out, STP out): •If redeemed within 1 year (365 days) from the date of allotment: 1% •If redeemed after 1 year (365 days) from the date of allotment: NIL |
| Plans Available | Regular Plan and Direct Plan |
| Options Available | Growth Option and IDCW^ Option (Payout & Re-investment) |
| Monthly Average AUM (₹ Cr.) as on August 31, 2022 | 33,536.46 |
| Net AUM (₹ Cr.) | 33,746.57 |
| Monthly Avg. Expense Ratio (Including Statutory Levies) as on August 31, 2022 |
Regular Plan: 1.58% Direct Plan: 0.49% |
| **For experience of Fund Managers Click Here | |
| ^Pursuant to Notice cum addendum dated March 27, 2021 the nomenclature of dividend option has been changed w.e.f. April 01, 2021. | |
| NAV: | Direct | Regular |
| Growth | ₹ 86.450 | ₹ 78.925 |
| IDCW^ | ₹ 53.245 | ₹ 23.825 |
| Volatility | 21.45% |
| Beta: | 0.94 |
| R Squared | 0.98 |
| Sharpe Ratio#: | 0.55 |
| Information Ratio | -0.62 |
| Portfolio Turnover Ratio | 0.21 times |
@The Volatility, Beta, R Squared, Sharpe Ratio & Information Ratio are calculated on returns from last three years Monthly data points. # Risk free rate: FBIL OVERNIGHT MIBOR as on 30th August, 2022. ^Basis last rolling 12 months. |
|
| Portfolio Holdings | % Allocation | |
| HDFC Bank Ltd | 0.09830077 | |
| HDFC Bank Ltd | 9.83% | |
| ICICI Bank Ltd | 9.59% | |
| Axis Bank Ltd | 4.41% | |
| State Bank of India | 3.80% | |
| Kotak Mahindra Bank Ltd | 0.44% | |
| Infosys Ltd | 0.07143554 | |
| Infosys Ltd | 7.14% | |
| Tata Consultancy Services Ltd | 2.61% | |
| HCL Technologies Limited | 2.06% | |
| MphasiS Limited | 0.58% | |
| Reliance Industries Ltd | 0.0708581 | |
| Reliance Industries Ltd | 7.09% | |
| Hindustan Petroleum Corporation Ltd | 1.09% | |
| Sun Pharmaceutical Industries Ltd | 0.0244785 | |
| Sun Pharmaceutical Industries Ltd | 2.45% | |
| Dr. Reddy's Laboratories Ltd | 1.48% | |
| Gland Pharma Limited | 1.39% | |
| Torrent Pharmaceuticals Ltd | 0.75% | |
| Biocon Ltd | 0.38% | |
| Ajanta Pharma Ltd | 0.37% | |
| Divi's Laboratories Ltd | 0.18% | |
| Crompton Greaves Consumer Electricals Limited | 0.01339711 | |
| Crompton Greaves Consumer Electricals Limited | 1.34% | |
| Kajaria Ceramics Ltd | 1.33% | |
| Havells India Ltd | 1.23% | |
| Titan Company Ltd | 1.11% | |
| Voltas Ltd | 0.99% | |
| Asian Paints Ltd | 0.12% | |
| Hindustan Unilever Ltd | 0.02789834 | |
| Hindustan Unilever Ltd | 2.79% | |
| ITC Ltd | 1.67% | |
| SBI Cards and Payment Services Limited | 0.01663882 | |
| SBI Cards and Payment Services Limited | 1.66% | |
| Housing Development Finance Corporation Ltd | 1.21% | |
| Muthoot Finance Limited | 1.03% | |
| Power Finance Corporation Ltd | 0.04% | |
| Bharti Airtel Ltd | 0.03761944 | |
| Bharti Airtel Ltd | 3.76% | |
| Max Financial Services Ltd | 0.01033616 | |
| Max Financial Services Ltd | 1.03% | |
| SBI Life Insurance Company Limited | 0.97% | |
| ICICI Lombard General Insurance Company Limited | 0.93% | |
| HDFC Life Insurance Company Ltd | 0.62% | |
| Maruti Suzuki India Ltd | 0.01993849 | |
| Maruti Suzuki India Ltd | 1.99% | |
| Eicher Motors Ltd | 0.71% | |
| TVS Motor Company Ltd | 0.32% | |
| Larsen & Toubro Ltd | 0.022934 | |
| Larsen & Toubro Ltd | 2.29% | |
| Ambuja Cements Limited | 0.01190437 | |
| Ambuja Cements Limited | 1.19% | |
| Nuvoco Vistas Corporation Limited | 0.59% | |
| Avenue Supermarts Limited | 0.00857001 | |
| Avenue Supermarts Limited | 0.86% | |
| Zomato Limited | 0.78% | |
| Sona BLW Precision Forgings Limited | 0.00849691 | |
| Sona BLW Precision Forgings Limited | 0.85% | |
| Balkrishna Industries Ltd | 0.42% | |
| NTPC Ltd | 0.01187162 | |
| NTPC Ltd | 1.19% | |
| Vinati Organics Ltd | 0.00593589 | |
| Vinati Organics Ltd | 0.59% | |
| Chemplast Sanmar Limited | 0.50% | |
| Ashok Leyland Limited | 0.01059056 | |
| Ashok Leyland Limited | 1.06% | |
| Tata Steel Ltd | 0.01034203 | |
| Tata Steel Ltd | 1.03% | |
| Indian Energy Exchange Ltd | 0.01028323 | |
| Indian Energy Exchange Ltd | 1.03% | |
| Jubilant Foodworks Limited | 0.00921863 | |
| Jubilant Foodworks Limited | 0.92% | |
| PI Industries Limited | 0.0088473 | |
| PI Industries Limited | 0.88% | |
| Bharat Electronics Ltd | 0.0080014 | |
| Bharat Electronics Ltd | 0.80% | |
| Britannia Industries Ltd | 0.00774425 | |
| Britannia Industries Ltd | 0.77% | |
| Krishna Institute Of Medical Sciences Limited | 0.0075447 | |
| Krishna Institute Of Medical Sciences Limited | 0.75% | |
| National Aluminium Company Limited | 0.00718308 | |
| National Aluminium Company Limited | 0.72% | |
| EPL Limited | 0.00576543 | |
| EPL Limited | 0.58% | |
| One 97 Communications Limited | 0.00274184 | |
| One 97 Communications Limited | 0.27% | |
| Dabur India Ltd | 0.0000967 | |
| Dabur India Ltd | 0.01% | |
| Equity Holding Total | 98.61% | |
| Cash & Other Receivables | 1.39% | |
| Total | 100.00% | |
| Positions Increased |
| Stock |
| Retailing |
| Zomato Limited |
| Industrial Products |
| EPL Limited |
| Telecom - Services |
| Bharti Airtel Limited |
| Consumer Durables |
| Crompton Greaves Consumer Electricals Limited |
| Auto Components |
| Sona BLW Precision Forgings Limited |
| Pharmaceuticals & Biotechnology |
| Gland Pharma Limited |
| Sun Pharmaceutical Industries Limited |
| IT - Software |
| HCL Technologies Limited |
| Capital Markets |
| Indian Energy Exchange Limited |
| Banks |
| Axis Bank Limited |
| HDFC Bank Limited |
| Kotak Mahindra Bank Limited |
| Automobiles |
| Maruti Suzuki India Limited |
| Positions Decreased |
| Stock |
| Finance |
| Power Finance Corporation Limited |
| Insurance |
| HDFC Life Insurance Company Limited |
| Aerospace & Defense |
| Bharat Electronics Limited |
| Automobiles |
| Eicher Motors Limited |
| TVS Motor Company Limited |
| Petroleum Products |
| Reliance Industries Limited |
| Diversified FMCG |
| Hindustan Unilever Limited |
| Banks |
| ICICI Bank Limited |
| State Bank of India |
| Pharmaceuticals & Biotechnology |
| Dr. Reddy's Laboratories Limited |
| Record Date | IDCW (₹) | Face Value (₹) | Cum Nav (₹) |
06-Dec-18 |
1.42 per Unit |
10 |
18.190 |
16-Dec-19 |
1.33 per Unit |
10 |
19.115 |
23-Mar-21 |
1.65 per Unit |
10 |
21.616 |
Past Performance may or may not be sustained in future. Pursuant to payment of IDCW the NAV of the IDCW option of the scheme will fall to the extent of payout and statutory levy (if any). IDCW history is for MALCF- Regular Plan - IDCW Option
| Returns (in%) | ||||
| 1 Yr | 3 Yrs | 5 Yrs | SI | |
| MALCF | 2.23% |
17.02% |
12.12% |
15.41% |
| Scheme Benchmark* | 5.72% |
18.89% |
13.37% |
11.66% |
| Additional Benchmark** | 4.80% |
18.16% |
14.75% |
11.40% |
| NAV as on 30th August, 2022 | ₹ 78.925 | |||
| Index Value (30th August, 2022) | Index Value of Nifty 100 Index (TRI) is 24,082.01 and S&P BSE Sensex (TRI) is 89,828.75 |
|||
| Allotment Date | 4th April, 2008 | |||
| Scheme Benchmark | *NIFTY 100 (TRI) | |||
| Additional Benchmark | **S&P BSE Sensex (TRI) | |||
Fund managers : Mr. Gaurav Khandelwal (since October 18, 2021) and Mr. Gaurav Misra (since January 31, 2019)
Note: Returns below or for 1 year are absolute returns, returns above 1 year are CAGR- Compounded Annualized Growth returns.
| Period | Total Amount Invested | Mkt Value as on 30-August-2022 |
SI |
1,720,000 |
6,132,483 |
10 Yrs |
1,200,000 |
2,686,289 |
7 Yrs |
840,000 |
1,407,641 |
5 Yrs |
600,000 |
867,969 |
3 Yrs |
360,000 |
473,908 |
1 Yr |
120,000 |
123,043 |
Returns (%) |
Period |
|||||
SI |
10yrs |
7yrs |
5yrs |
3yrs |
1yr |
|
Fund Return& (%) |
16.24 |
15.40 |
14.50 |
14.77 |
18.74 |
4.76 |
Benchmark Return& (%) |
13.77 |
14.41 |
15.35 |
16.45 |
21.57 |
9.85 |
Add. Benchmark Return& (%) |
13.58 |
14.37 |
15.69 |
16.55 |
20.47 |
8.63 |
& The SIP returns are calculated by XIRR approach assuming investment of ₹ 10,000/- on the 1st working day of every month.
This product is suitable for investors who are seeking*
• To generate long term capital appreciation / income
• Investment predominantly in Large Cap companies

*Investors should consult their financial advisers if they are not clear about the suitability of the product.
Past Performance may or may not be sustained in future.
Note : For computation of since inception returns (%) the allotment NAV has been taken as ₹ 10.00. The performance of other funds managed by the same fund managers are given in the respective page of the schemes 
Different Plans under the scheme has different expense structure. The reference and details provided here in are of Regular Plan - Growth Option