MIRAE ASSET
TAX SAVER FUND - (MATSF)
(ELSS - An open ended equity linked saving scheme with a statutory lock in of 3 years and tax benefit)
| Type of Scheme | ELSS - An open ended equity linked saving scheme with a statutory lock in of 3 years and tax benefit |
| Investment Objective | The investment objective of the scheme is to generate long-term capital appreciation from a diversified portfolio of predominantly equity and equity related instruments. The Scheme does not guarantee or assure any returns |
| Fund Manager** | Mr. Neelesh Surana (since inception) |
| Allotment Date | 28th December, 2015 |
| Benchmark Index | Tier-1 - Nifty 500 (TRI) Tier-2 - Nifty 200 (TRI) |
| Minimum Investment Amount |
₹500/- and in multiples of ₹500/- thereafter |
Systematic Investment Plan (SIP) (Any Date SIP is available from 1st July, 2019) |
Monthly and Quarterly: Minimum installment of ₹500/- and in multiples of ₹500/- thereafter. |
| Load Structure | Entry Load:NA Exit Load: NIL |
| Plans Available | Regular Plan and Direct Plan |
| Options Available | Growth Option and IDCW^ Option (Payout & Re-investment) For Mirae Asset Tax Saver Fund only growth and IDCW payout option are available. |
| Monthly Average AUM (₹ Cr.) as on April 29, 2022 | 12,103.98 |
| Net AUM (₹ Cr.) | 11,962.66 |
| Monthly Avg. Expense Ratio (Including Statutory Levies) as on April 29, 2022 |
Regular Plan: 1.64% Direct Plan: 0.52% |
| **For experience of Fund Managers Click Here | |
| ^Pursuant to Notice cum addendum dated March 27, 2021 the nomenclature of dividend option has been changed w.e.f. April 01, 2021. | |
| NAV: | Direct | Regular |
| Growth | ₹ 33.139 | ₹ 30.277 |
| IDCW | ₹ 23.448 | ₹ 20.582 |
| Volatility | 22.39% |
| Beta: | 0.98 |
| R Squared | 0.98 |
| Sharpe Ratio#: | 0.70 |
| Information Ratio | 1.08 |
| Portfolio Turnover Ratio | 0.71 times |
@The Volatility, Beta, R Squared, Sharpe Ratio & Information Ratio are calculated on returns from last three years Monthly data points. # Risk free rate: FBIL OVERNIGHT MIBOR as on 29th April, 2022.^Basis last rolling 12 months. |
|
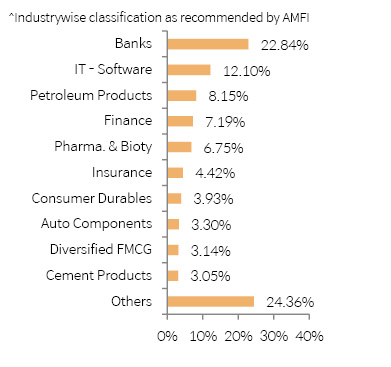
| Portfolio Holdings | % Allocation | |
| Banks | ||
| HDFC Bank Ltd | 7.31% | |
| ICICI Bank Ltd | 6.45% | |
| Axis Bank Ltd | 4.01% | |
| State Bank of India | 3.48% | |
| Equitas Small Finance Bank Ltd | 0.93% | |
| Kotak Mahindra Bank Ltd | 0.66% | |
| IT - Software | ||
| Infosys Ltd | 6.11% | |
| Tata Consultancy Services Ltd | 3.18% | |
| HCL Technologies Ltd | 1.96% | |
| MphasiS Ltd | 0.85% | |
| Petroleum Products | ||
| Reliance Industries Ltd | 6.59% | |
| Bharat Petroleum Corporation Ltd | 1.56% | |
| Finance | ||
| Housing Development Finance Corporation Ltd | 2.29% | |
| SBI Cards and Payment Services Ltd | 1.70% | |
| Muthoot Finance Ltd | 1.30% | |
| Shriram Transport Finance Company Ltd | 1.23% | |
| Cholamandalam Investment and Finance Company Ltd | 0.35% | |
| Power Finance Corporation Ltd | 0.32% | |
| Pharmaceuticals & Biotechnology | ||
| Sun Pharmaceutical Industries Ltd | 2.39% | |
| Gland Pharma Ltd | 1.59% | |
| Torrent Pharmaceuticals Ltd | 1.43% | |
| Aurobindo Pharma Ltd | 1.27% | |
| Dr. Reddy's Laboratories Ltd | 0.05% | |
| Divi's Laboratories Ltd | 0.00% | |
| Insurance | ||
| HDFC Life Insurance Company Ltd | 1.51% | |
| Max Financial Services Ltd | 1.13% | |
| ICICI Lombard General Insurance Company Ltd | 0.94% | |
| SBI Life Insurance Company Ltd | 0.84% | |
| Consumer Durables | ||
| Havells India Ltd | 1.42% | |
| Orient Electric Ltd | 1.18% | |
| Greenply Industries Ltd | 0.86% | |
| Titan Company Ltd | 0.27% | |
| Voltas Ltd | 0.21% | |
| Auto Components | ||
| Balkrishna Industries Ltd | 1.11% | |
| Motherson Sumi Wiring India Ltd | 0.83% | |
| Sona BLW Precision Forgings Ltd | 0.69% | |
| S.J.S. Enterprises Ltd | 0.36% | |
| CEAT Ltd | 0.31% | |
| Diversified FMCG | ||
| Hindustan Unilever Ltd | 1.80% | |
| ITC Ltd | 1.33% | |
| Cement & Cement Products | ||
| Ambuja Cements Ltd | 1.53% | |
| JK Cement Ltd | 1.52% | |
| Construction | ||
| Larsen & Toubro Ltd | 2.56% | |
| Chemicals & Petrochemicals | ||
| Vinati Organics Ltd | 1.21% | |
| Chemplast Sanmar Ltd | 0.88% | |
| Atul Ltd | 0.42% | |
| Industrial Products | ||
| SKF India Ltd | 1.40% | |
| Prince Pipes And Fittings Ltd | 1.02% | |
| Automobiles | ||
| Maruti Suzuki India Ltd | 1.32% | |
| Tata Motors Ltd | 1.01% | |
| Telecom - Services | ||
| Bharti Airtel Ltd | 2.08% | |
| Ferrous Metals | ||
| Tata Steel Ltd | 1.73% | |
| Power | ||
| NTPC Ltd | 1.54% | |
| Gas | ||
| Gujarat State Petronet Ltd | 1.51% | |
| Food Products | ||
| Britannia Industries Ltd | 1.39% | |
| Personal Products | ||
| Dabur India Ltd | 0.80% | |
| Emami Ltd | 0.40% | |
| Healthcare Services | ||
| Krishna Institute Of Medical Sciences Ltd | 0.94% | |
| Capital Markets | ||
| UTI Asset Management Company Ltd | 0.63% | |
| Indian Energy Exchange Ltd | 0.29% | |
| Transport Services | ||
| Gateway Distriparks Ltd | 0.68% | |
| Agricultural, Commercial & Construction Vehicles | ||
| Ashok Leyland Ltd | 0.48% | |
| Industrial Manufacturing | ||
| Tega Industries Ltd | 0.45% | |
| Entertainment | ||
| Zee Entertainment Enterprises Ltd | 0.40% | |
| Retailing | ||
| FSN E-Commerce Ventures Ltd | 0.36% | |
| Zomato Ltd | 0.02% | |
| Textiles & Apparels | ||
| Page Industries Ltd | 0.28% | |
| Financial Technology (Fintech) | ||
| One 97 Communications Ltd | 0.26% | |
| Non - Ferrous Metals | ||
| National Aluminium Company Ltd | 0.21% | |
| Aerospace & Defense | ||
| Bharat Electronics Ltd | 0.09% | |
| Equity Holding Total | 99.21% | |
| Cash & Other Receivables | 0.79% | |
| Total | 100.00% | |
| New Position Bought |
| Stock |
| Entertainment |
| Zee Entertainment Enterprises Limited |
| Finance |
| Shriram Transport Finance Company Limited |
| Non - Ferrous Metals |
| National Aluminium Company Limited |
| Positions Increased |
| Stock |
| Auto Components |
| Motherson Sumi Wiring India Limited |
| S.J.S. Enterprises Limited |
| Banks |
| Equitas Small Finance Bank Limited |
| HDFC Bank Limited |
| Chemicals & Petrochemicals |
| Atul Limited |
| Construction |
| Larsen & Toubro Limited |
| Finance |
| Housing Development Finance Corporation Limited |
| Muthoot Finance Limited |
| SBI Cards and Payment Services Limited |
| Food Products |
| Britannia Industries Limited |
| Gas |
| Gujarat State Petronet Limited |
| Healthcare Services |
| Krishna Institute Of Medical Sciences Limited |
| IT - Software |
| Tata Consultancy Services Limited |
| Personal Products |
| Emami Limited |
| Petroleum Products |
| Bharat Petroleum Corporation Limited |
| Pharmaceuticals & Biotechnology |
| Aurobindo Pharma Limited |
| Gland Pharma Limited |
| Retailing |
| FSN E-Commerce Ventures Limited |
| Telecom - Services |
| Bharti Airtel Limited |
| Positions Decreased |
| Stock |
| Aerospace & Defense |
| Bharat Electronics Limited |
| Auto Components |
| Balkrishna Industries Limited |
| Automobiles |
| Maruti Suzuki India Limited |
| Tata Motors Limited |
| Banks |
| ICICI Bank Limited |
| Kotak Mahindra Bank Limited |
| Capital Markets |
| Indian Energy Exchange Limited |
| Cement & Cement Products |
| Ambuja Cements Limited |
| Consumer Durables |
| Havells India Limited |
| Voltas Limited |
| Diversified FMCG |
| Hindustan Unilever Limited |
| ITC Limited |
| Finance |
| Cholamandalam Investment and Finance Company Ltd |
| Power Finance Corporation Limited |
| Power |
| NTPC Limited |
| Record Date | IDCW (₹) | Face Value ( ₹) | Cum Nav ( ₹) |
06-Dec-18 |
0.44 per Unit |
10 |
14.221 |
16-Jan-20 |
0.84 per Unit |
10 |
16.653 |
23-Mar-21 |
1.60 per Unit |
10 |
20.708 |
14-Mar-22 |
1.75 per Unit |
10 |
21.864 |
Past Performance may or may not be sustained in future.
Pursuant to payment of IDCW the NAV of the IDCW option of the scheme will fall to the extent of payout and statutory levy (if any). IDCW history is for MATSF - Regular Plan - IDCW Option
| Returns (in%) | ||||
| 1 Yr | 3 Yrs | 5 Yrs | SI | |
| MATSF | 18.42% |
19.55% |
16.65% |
19.09% |
| Scheme Benchmark* (Tier-1) | 20.87% |
16.52% |
13.76% |
14.62% |
| Scheme Benchmark* (Tier-2) | 20.07% |
15.71% |
13.77% |
14.44% |
| Additional Benchmark** | 18.19% |
14.77% |
15.10% |
14.53% |
| NAV as on 29th April, 2022 | 30.277 | |||
| Index Value (29th April, 2022) | Index Value of Scheme benchmark is 22,726.01 / 11,707.12 and S&P BSE Sensex (TRI) is 85,330.82 |
|||
| Allotment Date | 28th December, 2015 | |||
| Scheme Benchmark | *Tier-1-Nifty 500 (TRI) Tier-2-Nifty 200 (TRI) | |||
| Additional Benchmark | **S&P BSE Sensex (TRI) | |||
Fund manager : Mr. Neelesh Surana managing the scheme since 28th December, 2015
Note: Returns below or for 1 year are absolute returns, returns above 1 year are CAGR- Compounded Annualized Growth returns.
| Period | Total Amount Invested | Mkt Value as on 29-April-2022 |
SI |
750,000 |
1,372,512 |
5 Yrs |
600,000 |
967,006 |
3 Yr |
360,000 |
516,177 |
1 Yr |
120,000 |
122,417 |
Returns (%) |
Period |
|||
SI |
5yrs |
3yrs |
1yr |
|
Fund Return& (%) |
19.19 |
19.22 |
24.98 |
3.81 |
Benchmark Return (Tier-1)& (%) |
16.25 |
17.01 |
23.80 |
7.65 |
Benchmark Return (Tier-2)& (%) |
15.90 |
16.54 |
22.61 |
7.39 |
Add. Benchmark Return& (%) |
15.86 |
16.20 |
19.93 |
5.00 |
& The SIP returns are calculated by XIRR approach assuming investment of ₹ 10,000/- on the 1st working day of every month.
This product is suitable for investors who are seeking*
• Growth of capital over long term
• Invests predominantly in equity and equity related instruments: ELSS with a 3 year lock in period & tax benefits
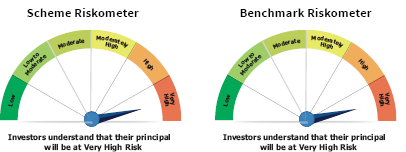
*Investors should consult their financial advisers if they are not clear about the suitability of the product.
Past Performance may or may not be sustained in future.
Note : For computation of since inception returns (%) the allotment NAV has been taken as ₹ 10.00. The performance of other funds managed by the same fund manager is given in the respective page of the schemes.
Different Plans under the scheme has different expense structure. The reference and details provided here in are of Regular Plan - Growth Option